OVERVIEW
Repute provides a rich set of tools for designing/analyzing onshore piles and pile groups, including:
- various types of pile, including augered, bored, H-, micro, pipe, spun, and square piles
- various design standards, including BS 8004 (2015 and 1986), Eurocode 7 (BS, IS, SS, and EN versions), NTC08, and custom
- various calculations, including capacity and settlement of single piles, Fleming’s back analysis, and boundary element method for single piles and pile groups
- algorithms for soil bearing and shaft friction (alpha, beta, bearing capacity, , earth pressure coefficient), no contact, plugging, rock bearing and friction, bearing pressure and skin friction limits, and wall friction
- pile groups under generalized 3-dimensional loading, using linear or non-linear soil models
USER INTERFACE
THE MAIN SCREEN
THE RIBBON
Shortcuts to frequently performed functions are available as icons displayed on the Quick-access toolbar.
A row of tabs on the Ribbon organizes commands into logical groups. There are further contextual tabs which provide buttons specific to certain panels and only appear on the Ribbon when the relevant panels are open.
THE DESKTOP
THE STATUS BAR
KEY FEATURES
THE DRAWING BOARD
- Cross-section
- Plan
- Elevation
The drawing can be dragged around the Drawing Board using the mouse and its scale adjusted using the mouse wheel.
When items are selected on the Drawing Board, they are automatically highlighted in the Project Manager and their properties displayed in the Property Inspector. A separate soil column in the left-hand margin displays the borehole, its layers, and soils.
Repute 2 synchronizes panels so that when an item is modified in the Property Inspector, it is automatically updated on the Drawing Board.
THE DRAWING BOARD TAB
The groups reflect the items’ type, e.g. the item ‘Steel’ appears in the group ‘Materials’.
When you click on an item in the Project Manager, its properties appear automatically in the Property Inspector (if open).
When you double-click on an item in the Project Manager, the Property Inspector is opened and the item’s properties are displayed.
The Project Manager’s context menu gives options to sort and edit items. It also enables new items to be created via the Stockyard.
THE PROJECT MANAGER
THE STOCKYARD
Items are organized into groups which are listed below the Stockyard’s main panel. The most frequently created items are listed in the “Common” group for easier access.
The toolbar at the bottom of the Stockyard gives options to alter which groups are displayed and which are hidden.
Items can be dragged from the Stockyard directly onto the Project Manager to create them. This will automatically select the new item in the Property Inspector (if open) so that its values can be altered.
THE INSERT TAB
THE PROPERTY INSPECTOR
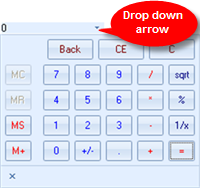
Numerical values can be entered using the built-in calculator (picture below) which appears from the drop down arrow on the right-hand side of the property boxes.
OUTPUT & DISPLAY
THE WORKBOOK

Results are organized into worksheets which can be displayed using tabs at the bottom of the page.
The layout of the data can be edited with highly customizable filters as well as options to group and sort the data.
THE WORKBOOK TAB

THE CUSTOM FILTER BOX

The Workbook keeps a history of previous filters so they can be reapplied easily.
THE GRAPH PAPER
The layout of the graph can be manipulated using a selection of buttons on the Graph Paper toolbar. From here the graph can also be copied and printed.

THE GRAPH PAPER TAB

THE GRAPH OPTIONS BOX

THE MESSAGE BOARD
Repute automatically judges the severity of a message, i.e. Information, Warnings, Errors, and Critical and separates them from each other. You can filter between these message types by clicking on tabs at the top of the panel.
The Message Board works in the background when minimized, and automatically appears when errors occur. You are able to adjust the severity threshold for when the panel appears.
Repute also records the date and time that messages are produced. Messages can be sorted chronologically or by severity.

THE MESSAGE BOARD TAB

REPORT
THE REPORTER
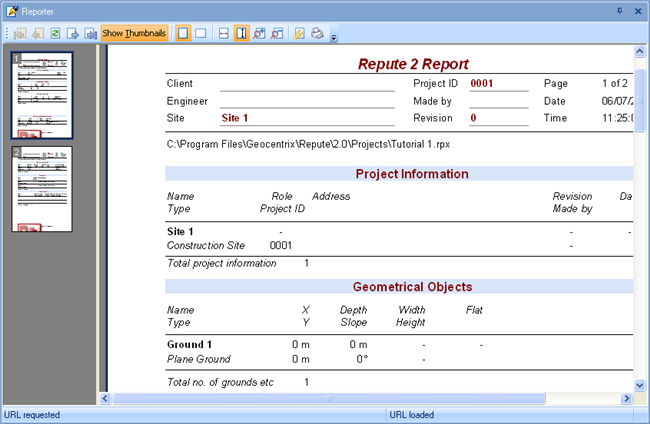
Each page of a report has a heading which gives key details of the report. Then there are specific sections for the different elements of the report.
The content of each report is highly customizable and there are more advanced options to modify the report available in the Repute Enterprise edition.
THE REPORTER TAB
Each page of a report has a heading which gives key details of the report. Then there are specific sections for the different elements of the report.
The content of each report is highly customizable and there are more advanced options to modify the report available in the Repute Enterprise edition.
WIZARDS
THE PROJECT WIZARD
In this process you can:
- enter the administrative details for your project
- select the design standards you want to use
- define the scenarios to be created
Once created, the project details are able to be altered at a later date.
THE WIZARDS TAB
THE BOREHOLE WIZARD
This process allows you to define all of the ground conditions for your site in one simple procedure. This involves:
- specifying the number of layers in the borehole
- specifying the thickness and soil type of each layer
- entering the drained properties of non-cohesive soils
- entering the undrained properties of cohesive soils
- selecting which scenario the borehole is to be used
Once created, the details of the borehole and its layers are able to be altered at a later date.
THE WIZARDS TAB
THE ACTION WIZARD
In this process you can:
- add several forces and moments and enter their magnitude and variability
- choose which of them to include in combinations
Once created, the details of the forces and moments are able to be altered at a later date.
THE WIZARDS TAB
THE PILE GROUP WIZARD
In this process you can:
- specify the number of piles and the plan arrangement
- enter the key properties of the piles
- enter the location and rotation of the pile group
- select the scenario the pile group is to be used in
Once created, the details of the pile group the plan arrangement are able to be altered at a later date.
THE WIZARDS TAB
THE ACTION WIZARD
In this process you can:
- add several forces and moments and enter their magnitude and variability
- choose which of them to include in combinations
Once created, the details of the forces and moments are able to be altered at a later date.
THE WIZARD'S TAB
THE CALCULATION WIZARD
In this process you can:
- choose a specific calculation
- apply a design standard
- select the scenario it is to be used in
Once created, the details of the calculation are able to be altered at a later date.


